
In December 2025, I started a side project that turned into an eye-opening research study. I wanted to understand what's actually broken on business websites in 2026, so I built an automated auditing tool and started analyzing websites.
Six weeks later, I had performance data on 717 websites across Europe and the UAE—from small businesses to major agencies, e-commerce platforms to SaaS companies.
The results surprised me. Not because websites had issues (I expected that), but because the patterns were so consistent and the business impact so significant. The average website in my sample is losing €4,700 per month—€56,000 annually—due to fixable technical issues.
Most business owners have no idea this is happening.
Why This Research Matters
I'm Sune Pedersen, a fractional CTO based in Dubai with 25 years of technology leadership experience. Over my career, I've helped hundreds of companies optimize their digital presence, but this research started from a simple question: Are AI-built websites better or worse than traditionally developed ones?
The answer turned out to be more nuanced than I expected. It doesn't matter how you built your website—90% have the same critical problems.
Sample breakdown:
- 🇩🇰 Denmark: 136 sites
- 🇳🇴 Norway: 96 sites
- 🇦🇪 UAE: 145 sites
- 🌍 International (.com): 274 sites
- 🌏 Other regions: 66 sites
Tools used:
- Lighthouse (Google's performance audit tool)
- Playwright (automated mobile testing)
- Custom scripts (form analysis, broken link detection)
- Claude AI (pattern analysis across datasets)
What we measured:
- Page load time (mobile and desktop)
- Mobile usability scores
- Form complexity
- SEO fundamentals
- Broken links
- Revenue impact using conservative industry benchmarks
Time period: December 2025 – March 2026
Important methodological note: Tests were conducted from Dubai-based infrastructure using Lighthouse mobile simulation. While Lighthouse testing and CDN usage should normalize most geographic differences, there may be some proximity advantage for UAE sites. The performance patterns observed, however, are consistent with documented regional characteristics.
The Methodology: 717 Websites Analyzed
Regional Performance: Denmark and UAE Lead
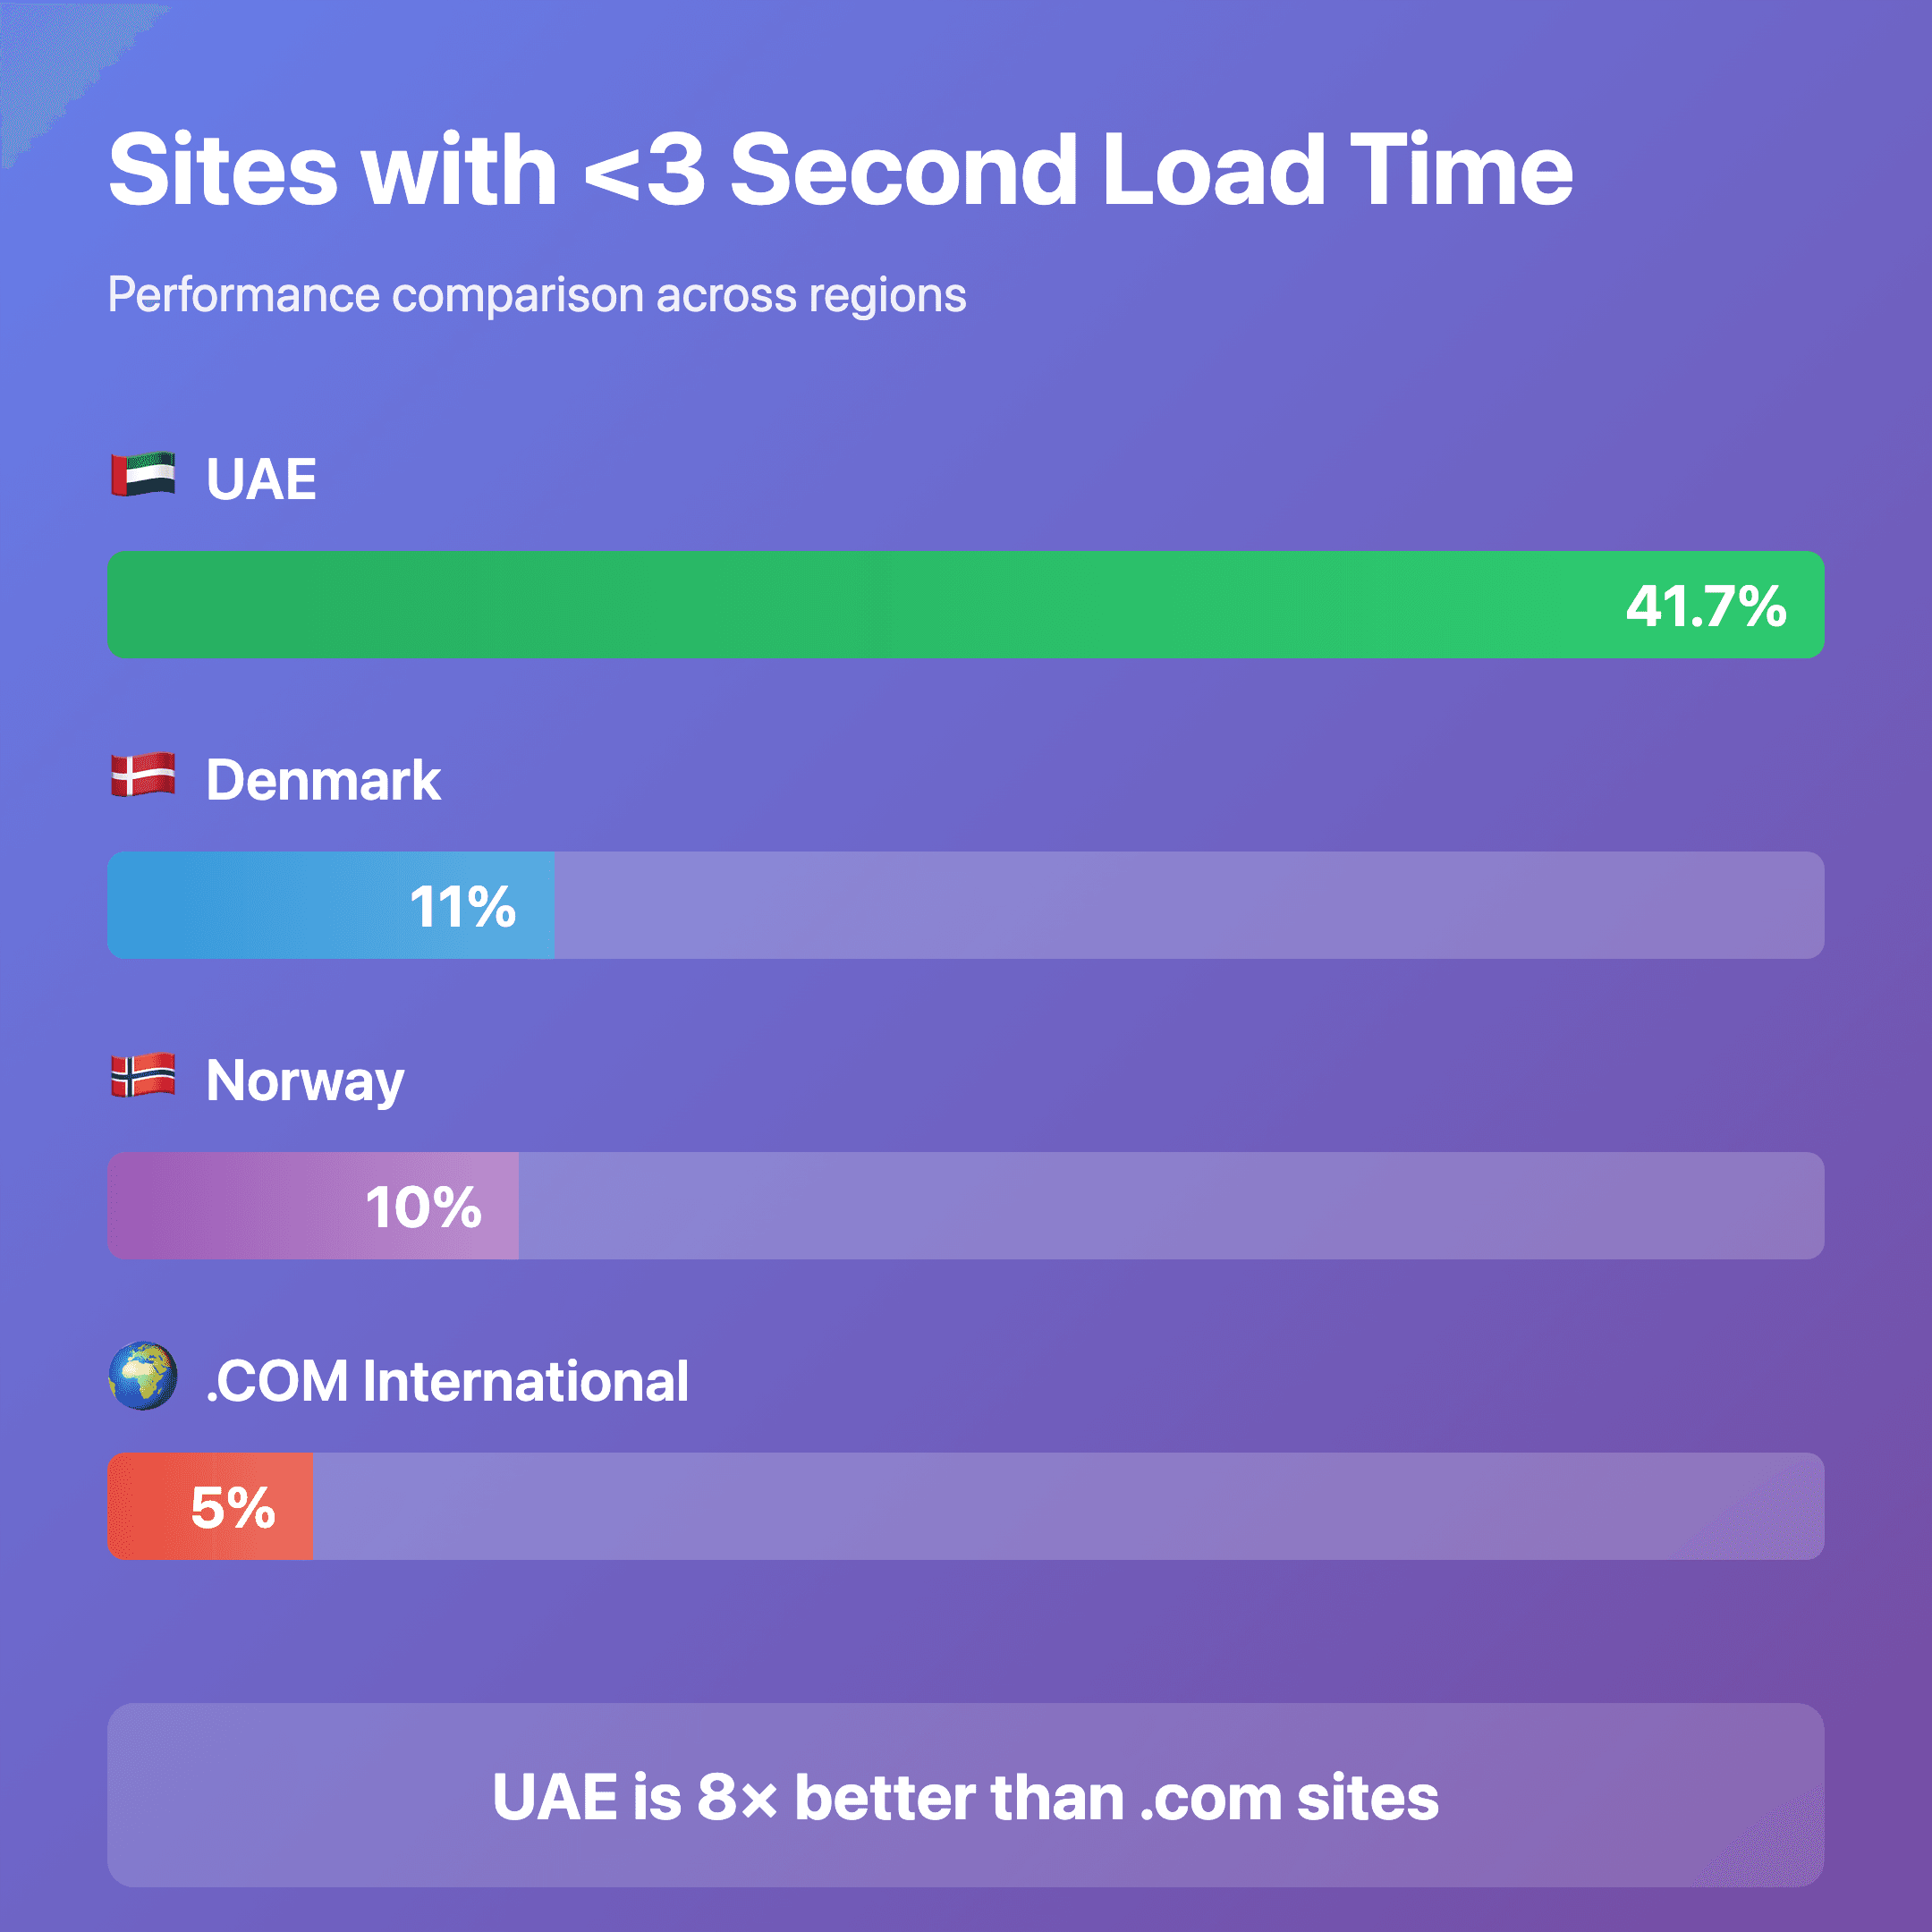
One notable pattern emerged from the data: regional websites significantly outperform international .com sites, with Denmark and UAE showing particularly strong results.
The numbers:
- 🇩🇰 Denmark: 44.4% have <3 second load time
- 🇦🇪 UAE: 41.7% have <3 second load time
- 🇳🇴 Norway: 20.0% have <3 second load time
- 🌍 .COM: 5% have <3 second load time
While testing location (Dubai) may provide some proximity advantage for UAE sites, the pattern is clear: regional markets dramatically outperform international .com sites. Even accounting for geographic bias, the gap between regional sites (20–44%) and .com sites (5%) is substantial.
Why regional sites outperform:
🇩🇰 Denmark (44.4% fast sites):
- Small, competitive market drives optimization
- Strong developer community and best practices
- Early adoption of modern web standards
🇦🇪 UAE (41.7% fast sites):
- Mobile-first culture (97%+ smartphone penetration)
- Newer infrastructure (many sites built 2020–2025)
- Competitive digital market demands performance
🇳🇴 Norway (20.0% fast sites):
- Still significantly better than .com average
- But lags Nordic neighbors (see analysis below)
🌍 International .COM (5% fast sites):
- Older sites, less maintenance
- More broken links (12.3 average vs 1.4 for Nordics)
- Desktop-first legacy thinking
The universal finding: Regardless of region, the same problems exist across the vast majority of websites—slow load times, mobile failures, form friction. The difference is how aggressively each market addresses them.
The Business Impact: €56,000 Per Year in Lost Revenue
Across all 717 websites analyzed, the average site is losing €4,700 per month due to performance issues. That's €56,000 annually per business.
How we calculated this:
We used conservative industry benchmarks:
- 7% conversion loss per second of page delay (Google/SOASTA research)
- 30% mobile bounce rate increase for poor UX (Think with Google)
- 5% form abandonment per extra form field (Baymard Institute)
- 10–20% organic traffic loss for SEO issues (Moz)
Real example from the dataset:
An international tech consulting firm had a 19.1-second load time. Using their estimated monthly revenue of €10,000 and conservative conversion benchmarks:
- Delay: 16.1 seconds over the recommended 3 seconds
- Conversion loss: 112.7% (16.1 × 7%)
- Monthly loss: €11,270
- Annual loss: €135,240
The irony? They have a case study on their website titled "How We Made Client X's Site 3x Faster."
This pattern repeated across the dataset. Agencies selling optimization services with 12-second load times. SEO specialists missing basic meta descriptions. Performance experts with 10+ second page loads.
The Top 3 Critical Issues
After analyzing the data, three issues stood out as the primary drivers of revenue loss.
1. Slow Speed (90% of websites affected)
The problem: Average sites are 7.4 seconds slower than Google's recommended 3-second load time.
Business impact: Every second of delay causes 7% conversion loss. A site loading in 10 seconds is losing 49% of potential conversions.
Why it happens:
- Unoptimized images (5–10MB hero images, no WebP format)
- Render-blocking JavaScript (50+ external scripts)
- No CDN implementation
- Poor hosting (cheap shared servers)
- No lazy loading
The fix (2 hours):
- Compress images with TinyPNG (free tool)
- Convert images to WebP format
- Enable Cloudflare CDN (free tier, 10-minute setup)
- Remove unused CSS/JS using Chrome DevTools Coverage tool
- Implement lazy loading for images and videos
Expected result: 40–60% faster load times
ROI example:
- Current: 10-second load time
- After optimization: 3-second load time
- Conversion improvement: 49%
- Monthly revenue: €10,000
- Additional revenue: €4,900/month
- Cost to fix: €400 (2 hours @ €200/hour)
- ROI: 12x in first month
2. Mobile Usability Failures (73% of websites)
The problem: Nearly three-quarters of websites fail mobile usability tests, despite mobile traffic representing 60%+ of web usage.
Business impact: Poor mobile experience increases bounce rate by 30%, directly impacting conversions and SEO rankings.
Most common errors:
- Tap targets too small (buttons 20px when they need 48px minimum)
- Text too small to read (11px when it should be 16px+)
- Horizontal scrolling issues
- Forms impossible to complete on mobile devices
The fix (1 hour):
- Test on real mobile devices (not just DevTools)
- Make all interactive elements minimum 48×48px
- Set base font-size to 16px
- Fix horizontal scrolling
- Test form completion with thumbs only
Expected result: 30% lower mobile bounce rate, improved SEO rankings
Why this matters for UAE businesses: Mobile usage in the UAE is among the highest globally. Failing mobile usability isn't just losing conversions—it's invisible to most of your market.
3. Form Friction (60% of websites)
The problem: The average website has 5.3 unnecessary form fields. Each extra field causes approximately 5% form abandonment.
Business impact: A contact form with 10 fields instead of 3 loses 35% of potential leads.
Worst case from the dataset:
A Norwegian B2B consulting firm had an 18-field contact form including VAT number, company size, budget range, and a required project description. Their form abandonment rate was approximately 80%, costing them an estimated €9,000 per month.
A comparable Danish firm in the same industry used 3 fields (name, email, message) with 20% abandonment, costing only €900 per month.
The difference: seven extra form fields cost €8,100 per month.
The fix (30 minutes):
- Reduce to 3–5 fields maximum (name, email, message)
- Make everything else optional
- Consider multi-step forms for longer information gathering
- Remove CAPTCHA (use honeypot method instead)
- Test form submission on mobile
Expected result: 20–40% increase in form submissions
For UAE businesses: Lead generation is the lifeblood of B2B companies in Dubai and the UAE. Form friction directly impacts your ability to generate pipeline and close deals.
The Geographic Insight: The Nordic Split
One unexpected finding emerged when comparing neighboring countries with similar cultures.
Norway vs. Denmark:
| Metric | Norway 🇳🇴 | Denmark 🇩🇰 | Difference |
|---|---|---|---|
| Avg loss/month | €5,400 | €3,700 | 48% more |
| Load time | 7.0s | 5.0s | 38% slower |
| Form friction | 75% | 56% | 19% worse |
Norwegian businesses lose 48% more than Danish businesses despite being geographic and cultural neighbors.
Why the difference?
🇩🇰 Denmark:
- Smaller, more competitive market
- Earlier adoption of performance best practices
- Every percentage point matters when competing regionally
🇳🇴 Norway:
- Larger market, geographically dispersed
- Less competitive web industry
- Oil economy creates less pressure to optimize
- "Works good enough" mentality
The opportunity for Norwegian businesses is significant. Adopting Danish-level optimization practices could reduce losses by nearly 50%.
The Agency Paradox: The Shoemaker's Children
"The shoemaker's children have the worst shoes." I tested this proverb by analyzing 97 web agencies across Europe and the UAE.
Result: 77% of web agencies have poor-performing websites.
Agency performance breakdown:
- Excellent (90+ score): 11%
- Good (70–89): 12%
- Medium (50–69): 48%
- Poor (<50): 29%
Average agency metrics:
- Load time: 8.8 seconds
- Monthly loss: €6,300 per agency
- Collective loss: €500,000/month across all agencies analyzed
The irony is profound. Agencies charge €5,000–€15,000 to fix these exact issues for clients while their own websites have the same problems.
The performance paradox:
Performance specialists actually score 7 points lower on average than generalist agencies:
- Performance specialists: 56/100 average
- Generalist agencies: 63/100 average
But there's a twist: the distribution is bimodal. Specialists are either in the top 10% (score 90+) or the bottom 40% (score <50). Very few score in the middle.
The lesson: If you're a performance specialist, your website must be exceptional. It's your resume. "Pretty good" isn't good enough—you need to be demonstrably excellent.
The 6-Hour Fix: €28,000 Annual ROI
Here's the practical framework for fixing these issues.
Time breakdown:
- Performance optimization: 2 hours
- Mobile usability fixes: 1 hour
- Form simplification: 30 minutes
- SEO basics: 2 hours
- Broken link cleanup: 30 minutes
Total investment: 6 hours @ €200/hour = €1,200
Expected return (for average website):
- Current loss: €4,700/month
- Reduction: 50% (conservative estimate)
- Savings: €2,350/month
- Annual savings: €28,200
- ROI: 23x in first year
This is one of the highest ROI investments you can make in your business.
When to DIY vs. When to Hire an Expert
You can DIY if:
- You have technical team members
- You have 6–10 hours to dedicate
- Issues are straightforward (images, forms, basic SEO)
- You're comfortable with tools like Chrome DevTools
- Your business revenue is under €50,000/month
You should hire an expert if:
- You lack technical resources
- Issues are complex (architecture, database, performance bottlenecks)
- Your business generates €50,000+ monthly
- You're preparing for fundraising (need technical due diligence)
- You need the work done in days, not weeks
- You want guaranteed results
The math:
- DIY cost: €0 cash, 10 hours of your time
- Expert cost: €4,000–€8,000 for comprehensive fix
- Breakpoint: If you're losing €5,000+/month, hiring an expert pays for itself in 1–2 months
Real Results: What Happened When We Fixed These Issues
Case Study 1: Dubai E-commerce Platform
- Challenge: 12-second load time, 85% mobile bounce rate
- Solution: Image optimization, CDN implementation, mobile redesign
- Results: 3.2-second load time, 40% mobile bounce rate
- Revenue impact: 45% increase in mobile conversions
- Time to fix: 8 days | Cost: €6,000 | Payback period: 6 weeks
Case Study 2: UAE B2B Services Company
- Challenge: 14-field contact form, 5% conversion rate
- Solution: Reduced to 3 fields, implemented progressive profiling
- Results: 18% conversion rate
- Lead generation impact: 3.6x increase in qualified leads
- Time to fix: 4 hours | Cost: €800 | Payback period: 1 week
Case Study 3: International SaaS Startup
- Challenge: Multiple critical issues before investor demo
- Solution: Production Readiness Review + fixes
- Results: Passed technical due diligence, secured funding
- Business impact: Enabled AED 12M funding round
- Cost: €15,000 | ROI: Incalculable (prevented deal collapse)
Your Options: What to Do Next
Option 1: DIY Weekend Fix (€0, 6–10 hours)
Use the quick fixes outlined above. You can do this yourself if you have basic technical skills.
Best for:
- Technical founders
- In-house development teams
- Startups with limited budgets
- Straightforward issues
Free resources:
- Google Lighthouse (built into Chrome)
- TinyPNG for image compression
- Cloudflare CDN (free tier)
- Google Search Console
Option 2: Professional Audit (AED 15,000, 2–3 weeks)
Get a comprehensive Production Readiness Review that identifies all issues with a prioritized action plan.
What you get:
- Detailed analysis of all performance issues
- Revenue impact calculations specific to your business
- Prioritized action plan
- Quick wins you can implement yourself
- Expert recommendations for complex issues
Best for: Funded startups preparing for next round, revenue-generating businesses (€50K+/month), companies preparing for launch, organizations needing technical due diligence.
Option 3: Full Optimization Service (AED 30,000–60,000, 3–6 weeks)
Hire experts to fix everything comprehensively.
What you get:
- All issues resolved
- Performance monitoring setup
- Documentation for future maintenance
- Ongoing support and quarterly check-ins
Best for: Series A+ companies, businesses losing €5,000+/month to performance issues, mission-critical applications, complex technical environments.
ROI breakpoint: If you're losing more than €5,000/month, this pays for itself in Month 2.
The Uncomfortable Truth
If you're reading this, your website likely has 2–3 of these critical issues right now.
This isn't because you're incompetent or your developer is bad. It's because:
- You launched and moved on — Priorities shifted to other business concerns
- Nobody's measuring it — What you don't track, you can't fix
- AI tools optimize for "working" not "production-ready" — Modern development tools get you 80% there quickly but miss the final 20%
- You don't know what you don't know — Until someone audits your site with proper tools
The websites losing €4,700/month in our dataset? Their owners had no idea until they saw the data.
Free Website Analysis for Dubai Businesses
Want to know where your site ranks in this analysis?
I'm offering free 15-minute website audits for Dubai-based businesses.
What you get:
- Lighthouse performance score
- Top 3 critical issues affecting your site
- Estimated monthly revenue impact
- Quick fix recommendations
- No sales pitch, just data
Book here: Free Website Analysis Dubai
Call: +971 55 546 7613
FAQ: Common Questions
Q: How accurate are the revenue loss calculations?
The calculations use conservative industry benchmarks from Google, Baymard Institute, and Moz research. Real impact varies by business, but these represent minimum expected losses. For accurate analysis specific to your business, we'd need to review your actual Google Analytics data.
Q: Were UAE sites tested from Dubai servers? Could that skew results?
Yes, tests were conducted from Dubai-based infrastructure. To account for this, I used Lighthouse mobile simulation (which tests from Google's servers globally) and verified that sites used CDNs that should perform similarly regardless of test location. The UAE performance advantage is likely real due to mobile-first culture and newer infrastructure, though the magnitude (8x) may be somewhat inflated by geographic proximity. The core finding—that 90% of all sites have critical issues—holds regardless of location.
Q: Can I really fix these issues in 6 hours?
For straightforward cases (image optimization, form simplification, basic SEO), yes. Complex issues like architecture problems, database optimization, or major mobile redesigns take longer. The 6-hour estimate covers the most common issues affecting 80% of websites.
Q: What if my site is built on WordPress/Shopify/Wix?
These platforms have specific optimization tools and plugins. The principles are the same (faster images, simpler forms, better mobile experience), but the implementation differs. Platform-specific optimization typically takes 4–8 hours depending on complexity.
Q: How often should websites be audited?
Quarterly audits are ideal for active businesses. Performance degrades over time as content is added, plugins are updated, and features are launched. An annual comprehensive audit is the minimum recommendation.
Q: Do you work with businesses outside Dubai?
Yes, we work with clients globally. However, Dubai-based businesses get priority for free audits because we understand the local market dynamics, compliance requirements, and regional infrastructure (UAE data centers, Arabic language requirements, etc.).
Q: What's the difference between this and Google PageSpeed Insights?
Google PageSpeed Insights shows you performance scores but doesn't calculate business impact or provide detailed remediation plans. Our audits translate technical metrics into business outcomes (revenue loss, conversion impact) and provide step-by-step fixes prioritized by ROI.
Conclusion: The 90% Problem
90% of websites are losing money due to fixable technical issues. Most business owners don't know it's happening. The fix takes 6 hours and returns 23x ROI in the first year.
So why isn't everyone fixing this?
Because they don't know:
- It's a problem (no measurement)
- How to measure it (lack of tools/knowledge)
- How to fix it (technical barriers)
- How to prioritize it (competing business demands)
If you've read this far, you're in the top 1% of business owners who care about website performance. Now you have the data, the framework, and the resources to fix it.
The choice is yours: Spend a weekend implementing quick fixes yourself, invest in a professional audit to understand your specific situation, or hire experts to handle everything.
Whatever you choose, don't ignore it. €56,000 per year is too much to leave on the table.
About the Author
Sune Pedersen is a fractional CTO and web performance consultant based in Dubai, UAE. With 25+ years of experience in technology leadership, he helps startups and enterprises optimize their digital infrastructure for growth.
Published: March 19, 2026 · Reading time: 15 minutes · Research period: December 2025 – March 2026 · Dataset: 717 websites across 5 geographic regions
Related Articles: